In this article we are going to see how to create a Matrix Report ,
Matrix reports display grouped data and summary information. You can group data by multiple fields or expressions in row and column groups.A matrix report grows horizontally and vertically on the page
lets see how to create one inventory matrix report based on location and item
Create one new report with data Item ledger entry
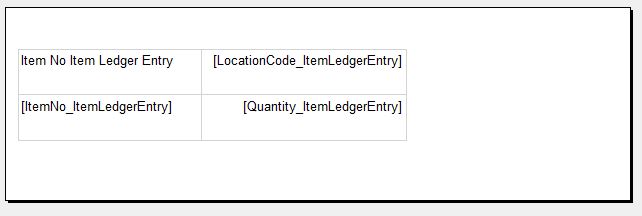
Open Visual Studio Report designer add matrix control
Select Row group field on Rows and Column Group fields in Column
Now I am selecting Item No as Row Group, Column group as Location code and Data as Quantity
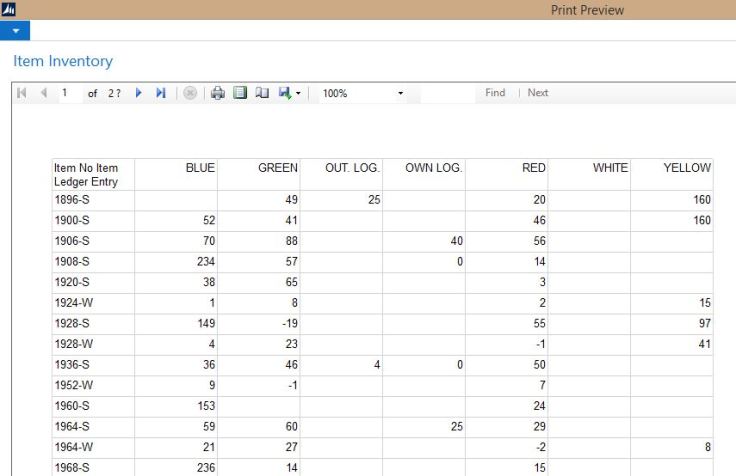
Report Output
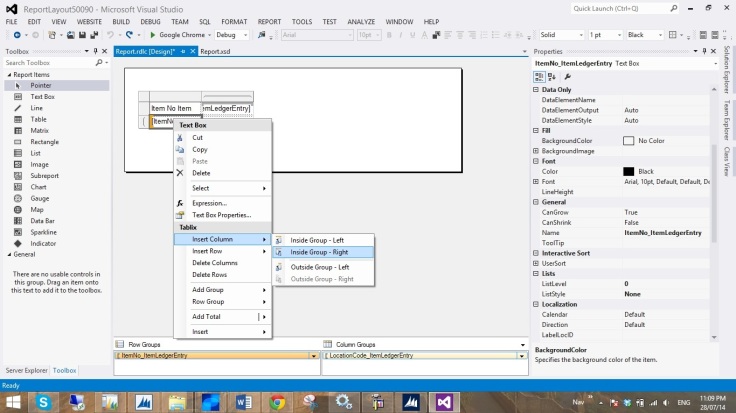
next insert Item description row after the item Number , Right Click Item No text box and select inside the group right and insert description field in the new text box
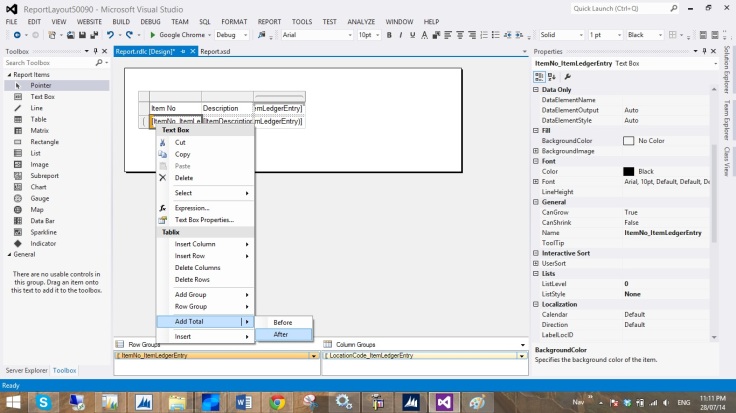
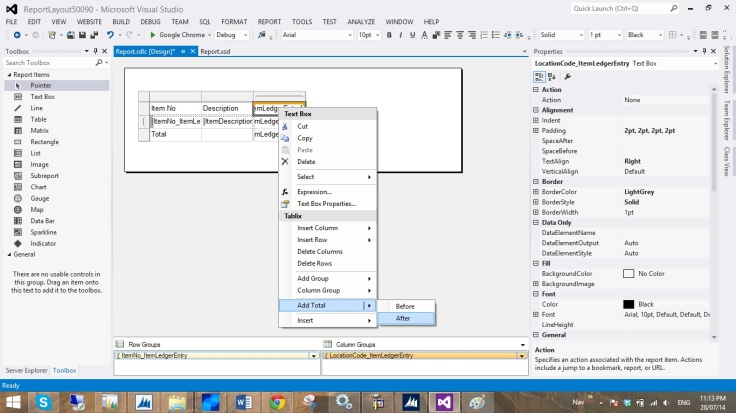
Insert Row Total in the report, Right Click Item No text box and select Add Total After
Insert Column Total in the report,, Right Click Location text box and select Add Total After
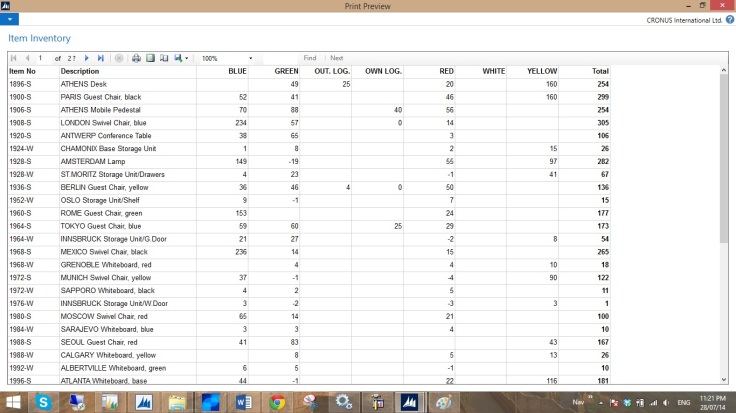
Final output grouped by item no and and location
you can download sample report from here


Good one Akhilesh… Very useful information..
LikeLike
Thanks Jithin….. 🙂
LikeLike
please explain month wise sales with matrix report
LikeLike
Thanks alot. Especially about the summing. At first I didnt even think it was possible. In any case, I think you left out the expression for the row/column sum. In my case it is: =Sum(Fields!Time.Value,”PD”) . PD is the name of the group I am summing.
LikeLike